From average guy to class leader


Bernd Weber is an everyman. He is not really tall, but not short either, likes to wear clothes in muted tones and moves slowly. He would probably describe himself as a man with important tasks, minor aches and pains, and in his prime.
Many of us know this Bernd from somewhere, better known by his initials BW. Let's take a closer look at this average guy. What does he really look like?

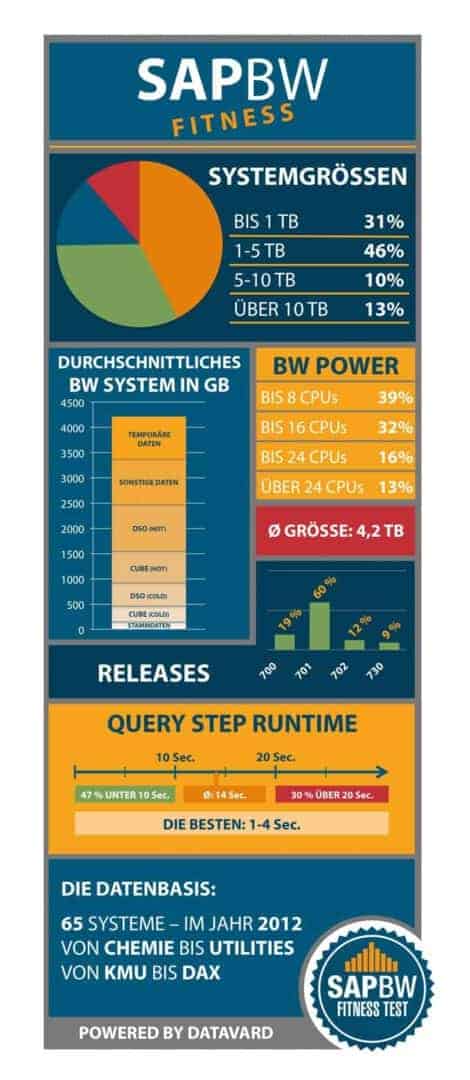
The results mentioned in this article are based on numerous automated analyses of productive business warehouse systems, which we conducted in 2012 as part of the DataVard SAP BW fitness test. The systems come from companies of various industries and sizes, from chemicals to utilities, from SMEs to DAX.
The average type
Our Bernd Weber, i.e. the absolute average SAP BW, has a system size of around 4.2 terabytes. Our overview shows that at 46 percent, almost half of all systems are also in the range between one and five terabytes.
A further 31 percent, i.e. every third system, is even smaller than one terabyte. Ten percent of the systems are five to ten terabytes in size, and only 13 percent of all systems we analyzed exceed the ten-terabyte limit.
In view of the current Big Data discussion, we ask ourselves where this trendy topic comes from in the context of SAP BW, since most systems are apparently not that big. In our opinion, however, an important indication of Big Data is not the pure system size, but the volume of data that has to be queried in a query.
In our average system, less than a third of the data is in the reporting layer. Furthermore, the system usually consists of more than 40 percent temporary and other data.
By other data we mean everything except master, cube, ODS, PSA data as well as ChangeLogs. We often find that the largest tables in this group are the BW statistics. The rest of the BW system is made up of the data preparation layers and the master data.
The size of a BW system allows few conclusions to be drawn about challenges in the future. An important indicator for this is growth. Our Bernd Weber has a growth rate of a proud 30 percent a year!
Of course, growing pains are not absent here. After two to three years, the system has doubled in size. On the one hand, the costs of existing storage technologies are falling and can thus absorb at least part of the growth financially.
On the other hand, we see current developments, such as in-memory computing, which are again driving up the cost per gigabyte. Growing data volumes lead not only to an increasing TCO (Total Cost of Ownership) but also to performance challenges.
The average system has a Weighted Query Step Runtime of 14 seconds. This result explains many a frustration on the user side. The pale appearance of our average guy is not only due to its inconspicuous characteristics, such as its size and performance, but also to its last upgrade.
Bernd Weber is a BW system on NetWeaver Release 7.01. Only nine percent of systems run on 7.30 and higher. This is particularly interesting in connection with Hana, because at least this release is required for a switch to this technology.
The class leader
In contrast to our inconspicuous average system, the class leader is a dazzling personality. We find the big difference in his stature and fitness. He is athletic and fast.
In contrast to the 14-second Weighted Query Step Runtime of the average guy, the Primus finished in four seconds - and without Hana at all. The body fat of the Primus is also interesting: The temporary and system data only account for 20 percent of the total system here.
Furthermore, data storage is leaner, since only current data is kept in the infoproviders and "cold" data is regularly outsourced. There are certainly many reasons for this good performance, three of which we will briefly present here:
1. the use of its good disposition, the on-board resources of a BW system, are an important success factor here. The data model is access time optimized - the reading effort per query is low. We calculate the number of rows to read per row output to measure this.
In the average system, 57 data records are read for every line displayed. In the top systems, there are only three to five lines. Such an optimization of the BW system can be achieved without external solutions.
2. the best systems have good housekeeping in common, which cleans out data that is not necessary for reporting and data preparation. The leading systems work here with fully automated solutions to ensure sustainability.
In contrast to these systems, when we examine many normal BW systems, we find that statistics and log tables are among the largest in the system. Here, the question arises whether the three-year-old query access statistics are as valuable as the previous day's incoming orders.
3. with the class leader, data is also divided according to frequency of access in order to optimize reporting times - this is typically implemented via time slices. Reporting time is therefore optimized because the amount of data accessed is reduced.
We observe two approaches for this: Partitioning and archiving/NearLine storage. In partitioning, the InfoProviders are often split manually. This can mean, for example, that the order data of each fiscal year is stored in a separate Infoprovider.
With archiving or near-line storage (NLS), the data is automatically downloaded from the active info provider after a retention period has expired. With the NLS interface, SAP has made it possible to keep the data fully accessible to users.
NLS is not synonymous with Sybase IQ: Depending on the solution used, the data is stored directly in the SAP system in a highly compressed form or loaded into a separate data store. The advantage over partitioning is that the system contains less ballast, since the old data makes up a smaller part of the system.
Conclusion
As we have seen, BW systems differ to a great extent. Performance in particular can quickly lead to frustration on the user side in average and below-average systems.
Hana is only of limited help here: A change in technology does not make a bad data model better. There are various ways to bring the system up to speed. A detailed analysis of the BW system is the best start to finding the right starting points for this.
In addition to an analysis of the current state, the SAP BW fitness test from DataVard also offers benchmarking with over 100 productive BW systems. This makes it possible to see at a glance in which areas your own business warehouse has potential for improvement.