Dashboards for decision makers


For more and more companies, the holistic overview of the current risk situation and the presentation of information is an increasing challenge. Management views of the current risk situation and its changes over time are needed, as are detailed work lists and guidance for subsequent actions. Piyush Pandey, CEO of Pathlock, emphasizes how critical it is that CISOs and IT departments have the right information to present to the CEO or board: "Only when CEOs understand the threat situation and the financial and business consequences of security breaches can business units get the budget they need."
This requires investing upfront in control measures, such as real-time threat detection. "Through proactive analytics, even companies with smaller budgets are able to identify their biggest risks so they can prioritize investments and remediation efforts. Executive dashboards offer a key advantage here," he explains. The focus is on a holistic view of regular, point-in-time parameter checks combined with real-time threat detection.
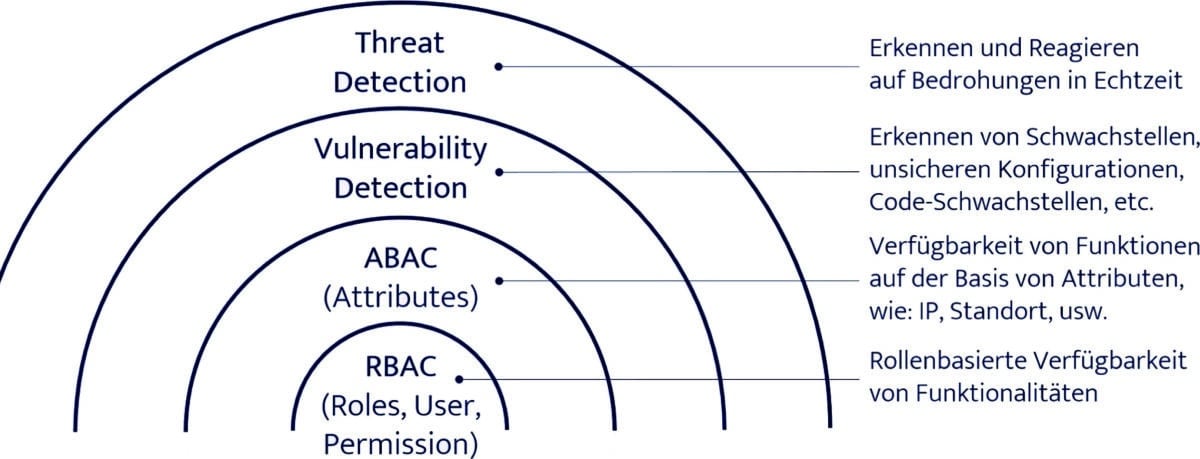
First of all, a location of the dashboards in the onion-skin model: A good role concept for the provision of functionalities is the core of a clean SAP system. Building on this, the availability of functionalities can be controlled on an attribute basis as a further security barrier, for example via the IP address or the time of access. If, for example, the role concept permits user access to technical drawings, this is blocked dynamically if access occurs outside normal working hours. Vulnerability Management, which involves the cyclical detection of vulnerabilities, and finally Threat Detection for real-time threat detection act as further layers. Pathlock dashboards reside in these outer shells and make sense of their information for security assessment and transparency.
Dashboard Strategy
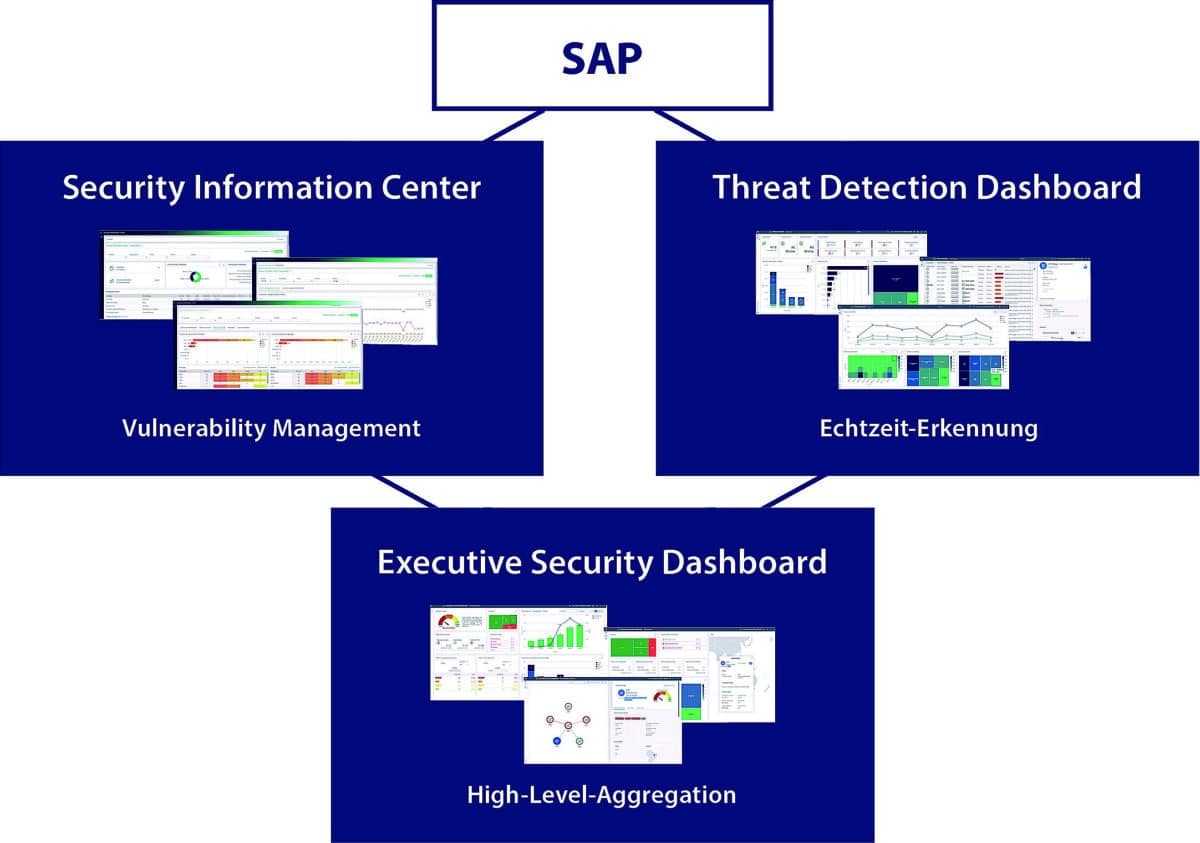
So what does a strategy look like for monitoring the SAP IT area and responding with dashboards? On the one hand, there is the Security Information Center to present and provide vulnerability management, i.e. cyclical monitoring, graphically and visually. On the other hand, there is the Threat Detection Dashboard, which collects and visualizes all findings from the area of real-time detection. Downstream, the key points from both areas are summarized and aggregated at management level in the executive dashboard to provide decision-makers with an overview of the overall security context.
Information Center
The Security Information Center includes our vulnerability management. Basically, it has to be said that software-driven support is necessary for this, because it is not feasible to check everything by hand. In this case, this is Pathlock Risk and Compliance Management, which runs cyclical checks, so-called audit checks, covering the most diverse areas of vulnerability management. And with the Security Information Center, it's possible to see at a glance what these evaluations have revealed. For example, whether
there are any missing OSS notes, critical configurations or gaps in the monitoring of an SAP landscape. Results of audit executions over time can be trended to immediately identify critical changes in the security situation.
In principle, there is the option of controlling any number of audit plans, even for multiple systems and with freely selectable schedules. Checks, such as whether all OSS notes are up to date, can thus run weekly or even daily if the systems in question have a very high security standard. Or you can set up a large general check on all systems once a month, depending on your own use case. And this can then result in different representations, which you can overview individually or aggregated.
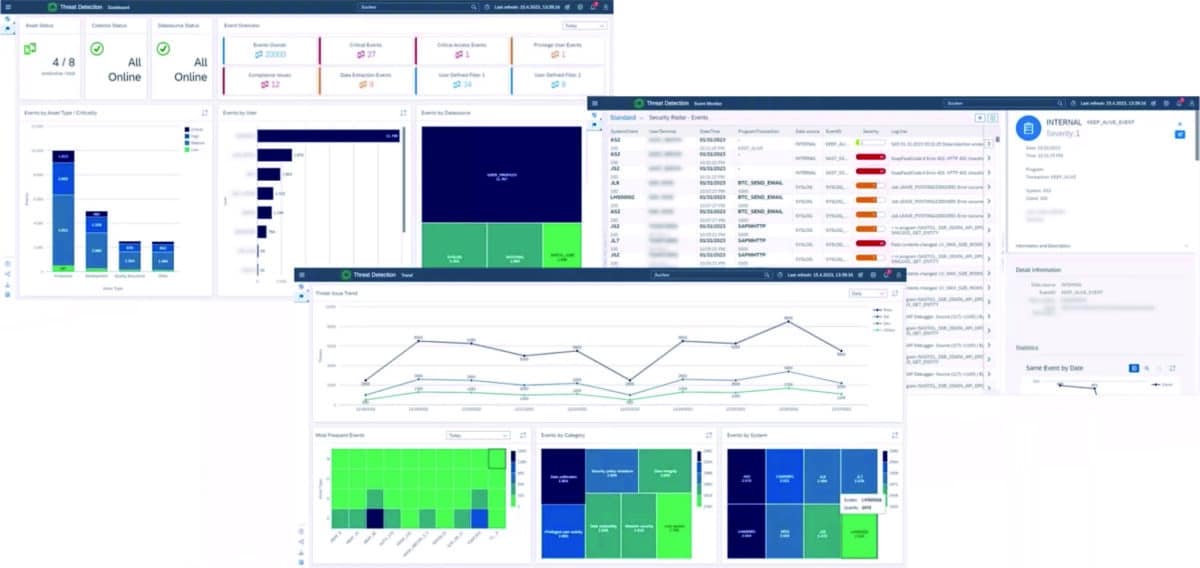
Threat Detection Dashboard - everything in view through highly customizable views.
Threat Detection
The Threat Detection Dashboard is essentially based on a collection of various data sources where log entries are written and correlations within these data sources are to be identified and evaluated. The dashboard is first used to determine the state of the data collection: Are the data collectors running at the intervals they should, are they sending data appropriately, and are they finding all data sources for each system? This provides an at-a-glance indication of whether data collection is working without error. Then the dashboard offers various aggregations to cluster events. For example, you can create filters on individual event areas to look at a specific system group or a single client. Different data sources can be viewed in relation to individual users, filters can be set for critical access events, and an overview of the total data volume can be displayed: From which sources does data come, by which users is it generated? What is the criticality and distribution with respect to productive development and test systems, but also according to the severity? What is critical data, how many critical events happened on which systems? From there, you can jump directly to the dashboard's event monitor to get detailed log information, perform correlative analysis, and determine correlations between individual events and log entries. Another option available to Threat Detection Dashboard users is the Trend View. It shows the distribution of events by origin, user and other categories over a period of time. With eight different diagrams to choose from, the Threat Detection Board is highly customizable to meet user needs.
Three dashboards
The Security Information Center, for example, serves security administration in the broadest sense, i.e. anyone who deals with audits or configuration monitoring, but also, for example, the CISO, who looks at how problems have developed over time and whether audits have been fulfilled. With the Threat Detection Dashboard, it's more security analysts who work here and use the event monitor, for example, and sometimes security decision-makers who need more detailed information or are tracking a specific trend. The new release of Pathlock now adds another level, the Executive Dashboard, to aggregate the data from Threat Detection and Vulnerability Management and present it at a glance.
SAP Security Dashboards - tailored to user needs.
Executive level
The most important information is immediately available at dashboard entry: Is a landscape at risk? How problematic is it? How does the system landscape look overall and have compliance criteria been met? In addition, various trend information can be found: How are vulnerabilities trending in relation to threats and is there a correlation? If an aspect needs to be looked at in more depth, there is always various follow-up information with detailed views, such as patch level - in other words, more specific information that may not be of interest to the CEO, but to the CIO or infrastructure manager. The Executive Security Dashboard also provides visualizations on the monitoring network: How are the connections from the central system to the managed systems? Are there connections that are currently not functioning? These are then indicated by a red line, whereby the specific finding is not specified precisely, because a decision-maker does not need to be informed down to the smallest detail. Instead, he receives high-level information: Is there a problem and how serious is it? Who is the point of contact for this system, who do I need to contact to get the problem solved? With the new Executive Security Dashboard, those responsible will therefore be able to make the best possible informed and well-founded decisions with the least possible effort in the future and initiate their implementation immediately.