The corpse in the basement
![[shutterstock.com: 109330997, pashabo]](https://e3mag.com/wp-content/uploads/2020/08/shutterstock_109330997.jpg)

One question was asked repeatedly by supply chain managers, plant managers and production planners when the new SCX suite was unveiled last year:
"Where do you guys at GIB actually get off telling us supply chain experts how to make our processes better?"
GIB's answer to this is very simple: "We're not giving you a patent case, we're just tracking down the skeletons in your closet."
And since every improvement process begins with the recognition that there is something to improve, the new GIB indicator model starts precisely there, with the creation of an awareness of the problem.
The GIB supply chain experts wanted to track down the causes instead of curing symptoms, in other words, to put their finger in the wound. Instead of using SAP Big Data in the usual manner to create new tools, views and analyses, they wanted to use the data to highlight gaps, uncover information deficiencies and question processes.
So how did the experts proceed? What were the key phases that led to the new indicator model? Volker Blöchl, Managing Director of GIB S&D, talks about five key steps in this context.
Five steps to recovery
Step 1, formulating an ideal-typical supply chain process: Not an easy task, considering that there are legitimate company- or industry-specific processes. How should a process be valid for batch and flow production, for discrete and process industries?
"The core processes and the core issues are always similar"explains Volker Blöchl.
"Whether it's a teddy bear manufacturer or an aircraft manufacturer, we've seen time and time again over the years that the problems supply chain professionals face are very similar at their core."
Time and again, the issues were inaccurate sales planning, inadequate master data, sediment, inventory holdbacks, safety stock, delivery service levels and delivery backlogs, to name just a few buzzwords.
"We chose a high level of abstraction to achieve comparability and uncover pain points that need to be discussed"explains the supply chain expert.
Step 2define potential weak points: After the ideal-typical process was formulated, the individual process sections were subjected to a detailed analysis. What happens in the inventory management phase, which activities and planning are elementary in procurement management, which criteria can evaluate sales planning? These and many other questions were discussed and analyzed by the GIB experts.
"We had our savvy process and SAP consultants on board", says Volker Blöchl, who was able to provide a lot of food for thought with his in-depth practical knowledge as a former operations and scheduling manager.
Again and again, the identified parameters were put to the test: Is the activity relevant for all industries? Is the activity meaningful for the process section under consideration? And last but not least, can data be found in the SAP system that relates to this activity? Time and again, the experts had to discard ideas and findings in order to do justice to the maxims they had set themselves.
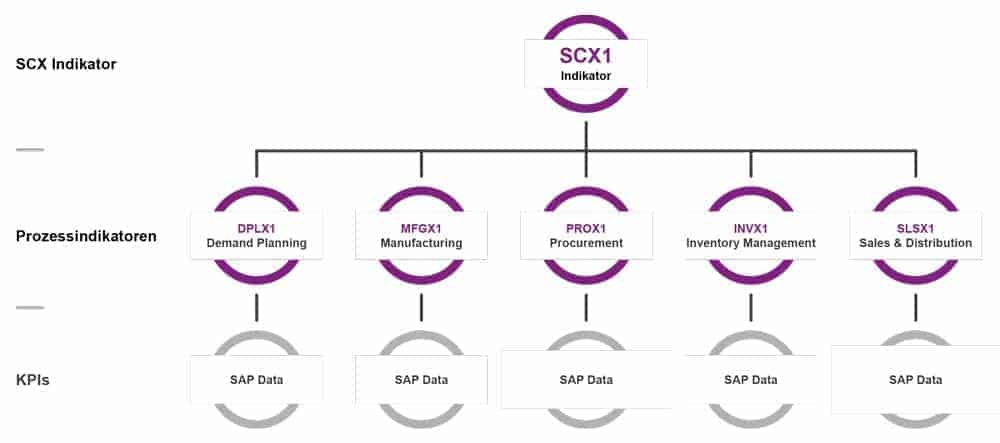
Step 3The experts agreed on five process steps, namely demand planning, manufacturing, inventory management, and sales and distribution: The experts agreed on five process steps, namely Demand Planning, Manufacturing, Procurement, Inventory Management and Sales and Distribution, and formed key figures that make quality measurable in the respective section.
"This was a big challenge, especially in demand planning"Volker Blöchl knows, because how can the quality of a plan be measured if the original plan is adapted and overwritten over time?
"In our GIB suite, we solved this problem long ago. We work with versions and store the history. But our SCX indicator model should be usable independently of our suite. We only access the original SAP data. This is the only way we can create a new standard"he continues.
The experts agreed on the evaluation of the materials and articles identified as plannable, their planning horizon, pre-planning without backlog, and the share of planned materials in the total material spectrum.
Step 4, condensing and weighting key figures: The result shows that the GIB experts were successful: Key figures could be determined for each process step. But how are these to be weighted? Is the delivery service level more important than the delivery backlog? Is adherence to delivery dates more important than adherence to quantity?
"Everything interlocks", Blöchl explains.
"It doesn't take a genius to know that a chain is only as strong as its weakest link."
For this reason, the experts decided to include each key figure with equal weight in the evaluation of the respective process step.
"We agreed on a percentage representation of quality. An individual rating scheme would always have required an explanation", he explains.
For example, in the case of a six-point scale, the question would have been whether a one is the best result according to the school grading system or whether the more the better. Also, the maximum value should always have been indicated; does the scale go up to ten or up to eighty, etc.?
"We have imposed the maxim Simplicity in all our products".says Blöchl, "so it quickly became clear we needed something that was intuitive and internationally understood."
Step 5, create comparability: A central point of the indicator model is the comparability of processes in one's own supply chain or in comparison with other companies. If the process indicator for manufacturing is 20 percent and the colleague from inventory management has an indicator of 95 percent, the first has done a lot wrong and the second has certainly done a lot right. Thinking further: If manufacturing in plant 1 is at 90 percent and in plant 2 of the same company at 50 percent, the production planners should urgently discuss why this is the case.
This comparability also works across companies: two material requirements planners from different companies are sure to have an interesting technical discussion about the respective backlog or delivery service level if their SCX differs greatly.
"I look forward to the day when one of our customers greets another with the question, 'How high is your SCX, anyway?'"predicts Blöchl.

Evaluation schemes
What is the benefit of knowing that your own supply chain is rated at 70 percent? What is the benefit of evaluating the individual supply chain process steps?
First example: A poor rating in Demand Planning shows that many articles and/or materials are not planned or only insufficiently planned. A common answer in this case is that the range of materials is too large or that planning is not possible at all.
But a look at the forecast often shows that only the forecasting procedures do not fit optimally, that a good planning result can already be achieved with the planning of the relevant and plannable articles or that quite simply more information must flow into the planning system (e.g. from sales and marketing) in order to create a realistic forecast.
Second example: A poor sales and distribution indicator can indicate that there is an imbalance in the delivery service level. If a company always strives to meet the desired delivery date, it may be stocking itself with an economically unreasonable inventory of finished products.
A poor value in the sales and distribution process could also result from a lack of delivery capability despite a full warehouse. This could be caused by poor or even missing sales planning, which leads to producing and stocking the wrong products.
"It's important to talk about the numbers and talk about the causes"Volker Blöchl sums up.
"We like to get into the discussion. We often come across statements like 'We've always done it that way' or 'That doesn't make sense for us.' In conversation, it then becomes apparent that things have crept in or that processes were never put to the test due to a lack of time."
He goes on to say that in his 34-year professional career with over 200 customer projects, he has never known there to be no need for optimization in supply chain processes.
"There's always a skeleton in the closet", he quips. "And we ferret them out."


